In my previous post, I wrote about how the data set is determined in Google Analytics at the view level and by how the tracking code is implemented. In this post, I’ll look at some my favorite tools for working with data in Google Analytics.
Working directly with the data occurs at the report level. At this level, you can change how the data is displayed and filtered, but you can’t alter what data is available.
There are many ways to interact with data in the reports. While I’ll run through some of the tools I find most useful, this is not a complete list. I’ll dig into other tools in later posts.
Working with data
Regular expressions
Learning how to use regular expressions is necessary if you want to use Google Analytics reports to their full potential. With regular expressions you can match and filter data.
For instance, if you are looking at the Geo location report and want to look at just the sessions from California and New York (and exclude the sessions from the rest of the states) you can filter down to just these two states with the regular expression: California|(New York)
Alternatively, if you want to look at just the stats for the pages in the top level navigation, you could write a regular expression to filter on the Site Content -> All Pages report so only those pages are returned in the results.
With regular expressions you have a concise, exact way to extract the data from the reports that you’re interested in. Regular expressions can be used throughout the Google Analytics interface.
Segments
Segments are one of the most useful tools for working with data in the Google Analytics reports.
With a segment you can isolate and examine data. Segments can be applied across most of the reports Google Analytics offers. For instance you could compare two segments – direct traffic and paid traffic – in the All Pages report to find out if there was a difference in what pages the two audience groups are interested in.
Access the segments through the interface at the top of the page:
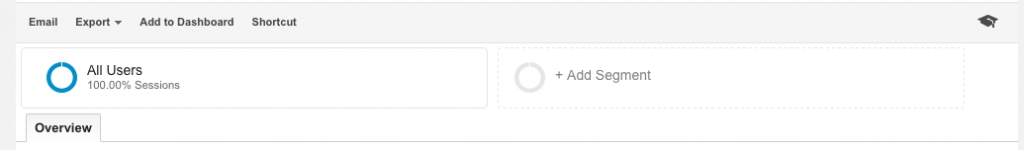
When you click on “All Users” or “+Add Segment” a menu comes up that lists all your segments.
Google Analytics includes some segments out of the box, such as Bounced Sessions, Mobile Traffic and Returning Users.
If the segment you want is not already available, you can build your own custom segment. For instance, you can build a segment that excludes all referrals or includes users based on when they first visited the site.
Segments are incredibly powerful and useful, but they do have some drawbacks, the most significant is that the data is sampled over longer time periods. If you’re looking at a report with relatively low numbers, this can skew data badly over relatively short periods of time. Even for larger data sets, it can still be a problem. Fortunately Google Analytics lets you know when the data is being sampled so you don’t get caught unaware.
On-page filters
You can narrow down the results set by using the filter at the top of many reports:

You can enter either text or a regular expression into the field. If you want more control, to the right of the box, there is an advanced link. This opens up:
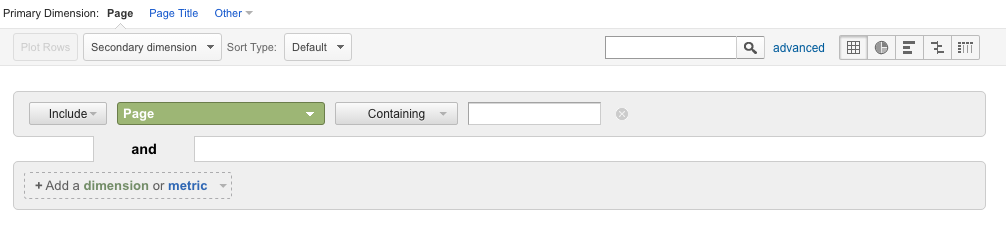
The advanced tool gives you more options, including being able to exclude as well as include data.
The filters are a fairly simple tool but immensely helpful for analyzing data as you can look at just the information you are interested in. You can do a quick and dirty analysis without ever having to open a spreadsheet.
Custom reports
Custom reports are a good way to extend Google Analytics capabilities to create exactly the reports you need.
To access custom reports, click on Customization in the upper navigation. When creating your report, you’ll need to add dimensions and metrics.
The difference between dimensions and metrics is often confusing for new users. A dimension is what you want to track (e.g. a page, new users, etc) and a metric is the measurement associated with what you want to track (e.g. the number of pageviews, the number of sessions, etc). This can be a bit confusing at first but it becomes self-evident with practice.
Once you have chosen the dimensions and metrics, you have the option to add a filter. For instance, you could filter on a specific medium such as organic, so only sessions with a medium of organic will appear in your custom report.
Finally you choose which view(s) to associate the custom report with.
Custom reports are a bit tricky so you always have to be sure you understand what you’re asking Google Analytics to do. For instance, if you have a dimension of page and a metric of users, the total number of users reported by the custom report will be correct. But if you add up the number of users associated with each page it will be significantly higher than your total number of users. This is because a user can visit more than one page. What Google Analytics is reporting is correct, but it’s easy to fall afoul of it if you don’t understand the output.
Conclusion
Over the last two posts I’ve looked at how the data set is determined in Google Analytics and reviewed some of the more useful ways the data can be worked with. Understanding when you’re changing what data is being pulled in and when you’re simply working with what’s already available is important as you will be less likely to accidentally damage your data set and you will find it easier to get accurate answers with Google Analytics.