Category Archives: Google Analytics

Google Analytics: Tracking logins

Software as a Service (SaaS) companies often place a link to the login in the top navigation of the marketing site. Both current customers and visitors to the marketing site come to the site and the two populations get mixed together in the Google Analytics reports. This can make it very difficult to analyze your data.

In this post, I’ll talk about why being able to separate these two audience groups matters and how to separate them in Google Analytics.

Why it matters

When current customers are mixed with visitors to the marketing site, it can cause problems when you analyze the data. For instance:

  • An important metric on marketing sites is the eCommerce conversion rate, i.e. the number of conversions divided by the number of sessions. It’s a useful metric when taken in context with other site data as it points to the effectiveness of a site. If a lot of people are coming to the marketing site to login, then it artificially lowers the eCommerce conversion rate. This is unfortunate as it makes the metric unusable.
  • On the flip side, if you don’t have a way to isolate the sessions that include a login, then it can be difficult to analyze the Google Analytics reports. Even a simple question like ‘How many sessions to the site included a login?’ can be very hard to answer.
  • In some cases it can also be useful to segment out how the users who are currently customers and logged in interact with the marketing site – this is especially true if the product includes upsells that direct customers to the marketing site.

By segmenting out the users who login, you get a better handle on how different audiences interact with your site.

Custom dimensions

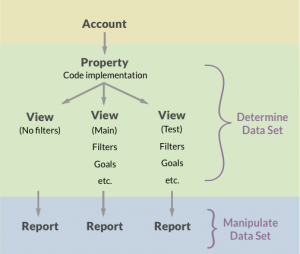
Custom dimensions add non-standard data to your Google Analytics reports (see the earlier post on determining the data set for background on how Google Analytics is structured).

A custom dimension is set at the property level. To set up a custom dimension, go to the admin section, in the property column click on Custom Definitions, and then select Custom Dimensions.

Unless you’re a premium user, you can only add 20 custom dimensions. When you set up the custom dimension it will ask you for name, scope and whether it should be active or not. How you set up the custom dimension will depend on your specific needs.

For instance, setting the scope to user sets the custom dimension at the user level. Even if the user does not log in on future visits, they will still be grouped into the custom dimension. This makes sense if you’re looking at binary situation where someone is either a customer or not a customer.

On the other hand, if you set the scope to session, then the custom dimension only lasts as long as the session does. If the user ends the session and then comes back, the second session will not be captured in the custom dimension. This might make sense if your users move fluidly between customer and prospect.

In order to track custom dimension, the developer will need to make changes to the code to capture the action you are interested in.

You can construct filters using custom dimensions. This is extremely powerful. You could set up a view that includes only logins by filtering on a custom dimension that tracks logins. You could use the same idea, but with an exclude filter, to remove all the logins and just view the visitors to the marketing site.

Using custom dimension to track logins is an elegant solution, and it’s embeds the data in the reports. For more details on how to set up custom dimensions, see this Google Analytics article.

Segments

In some cases, you won’t be able to use custom dimensions to track logins. There are only 20 custom dimensions available (unless you’re a premium customer) and perhaps they’ve been used for something else. Or perhaps you can’t get the resources to make the code changes that are necessary. Or maybe you can move forward with a custom dimension but you need to look at historical data. If you find yourself in a situation where you can’t employ custom dimensions, you may need to work with data at the report level using segments.

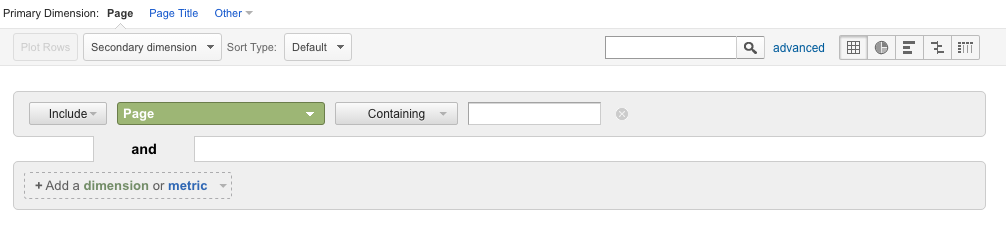
The exact set up of the segments will vary depending on the site, but the idea is to use the URL structure to segment by user. (If you’re not familiar with how to build a segment, check out this Google Analytics help doc.)

For instance, suppose your marketing site is on these three pages:

  • www.example.com/features
  • www.example.com/pricing
  • www.example.com/signup

The pages for customers behind the sign in are:

  • www.example.com/dashboard
  • www.example.com/app
  • www.example.com/stats

In this case you can set up a segment that filters using the dimension Page so you only include users who have visited /dashboard or /app or /stats, i.e. users who must be logged in because these pages can only be visited when someone is logged in. An exclude filter on the same lines would remove people who have logged in.

There are some downsides to this method, however.

Adding segments manipulates data that has already been passed into the report. Over long time periods or with large data sets, Google Analytics often uses sampled data when a segment is applied. Sampled data can, in some cases, be quite inaccurate.

These segments are also fairly difficult to get right. For instance, you have to capture every path in case someone has bookmarked a link directly into the app. Likewise, the URL structures that a user accesses when they log in has to be unique from the URL structure that exists for non-logged in users. For instance, if the marketing site and the application share a path in places, you may not be able to distinguish between the two audience groups. You also have to update the segment regularly if the URLs change, and this can be difficult to stay on top of.

Upshot

Custom dimensions are the better choice for separating logins from other audience groups visiting your marketing site. However, in some cases you will have to work with the data once it’s already been passed into the reports. When that is the case, segments can be a very powerful tool.

Google Analytics: Working with the data set

In my previous post, I wrote about how the data set is determined in Google Analytics at the view level and by how the tracking code is implemented. In this post, I’ll look at some my favorite tools for working with data in Google Analytics.

Working directly with the data occurs at the report level. At this level, you can change how the data is displayed and filtered, but you can’t alter what data is available.

There are many ways to interact with data in the reports. While I’ll run through some of the tools I find most useful, this is not a complete list. I’ll dig into other tools in later posts.

Working with data

Regular expressions

Learning how to use regular expressions is necessary if you want to use Google Analytics reports to their full potential. With regular expressions you can match and filter data.

For instance, if you are looking at the Geo location report and want to look at just the sessions from California and New York (and exclude the sessions from the rest of the states) you can filter down to just these two states with the regular expression: California|(New York)

Alternatively, if you want to look at just the stats for the pages in the top level navigation, you could write a regular expression to filter on the Site Content -> All Pages report so only those pages are returned in the results.

With regular expressions you have a concise, exact way to extract the data from the reports that you’re interested in. Regular expressions can be used throughout the Google Analytics interface.

Segments

Segments are one of the most useful tools for working with data in the Google Analytics reports.

With a segment you can isolate and examine data. Segments can be  applied across most of the reports Google Analytics offers. For instance you could compare two segments – direct traffic and paid traffic – in the All Pages report to find out if there was a difference in what pages the two audience groups are interested in.

Access the segments through the interface at the top of the page:

Segment Chooser on Reports

When you click on “All Users” or “+Add Segment” a menu comes up that lists all your segments.

Google Analytics includes some segments out of the box, such as Bounced Sessions, Mobile Traffic and Returning Users.

If the segment you want is not already available, you can build your own custom segment. For instance, you can build a segment that excludes all referrals or includes users based on when they  first visited the site.

Segments are incredibly powerful and useful, but they do have some drawbacks, the most significant is that the data is sampled over longer time periods. If you’re looking at a report with relatively low numbers, this can skew data badly over relatively short periods of time. Even for larger data sets, it can still be a problem. Fortunately Google Analytics lets you know when the data is being sampled so you don’t get caught unaware.

On-page filters

You can narrow down the results set by using the filter at the top of many reports:

Google Analytics on-page filter

You can enter either text or a regular expression into the field. If you want more control, to the right of the box, there is an advanced link. This opens up:

On page filter expanded

The advanced tool gives you more options, including being able to exclude as well as include data.

The filters are a fairly simple tool but immensely helpful for analyzing data as you can look at just the information you are interested in. You can do a quick and dirty analysis without ever having to open a spreadsheet.

Custom reports

Custom reports are a good way to extend Google Analytics capabilities to create exactly the reports you need.

To access custom reports, click on Customization in the upper navigation. When creating your report, you’ll need to add dimensions and metrics.

The difference between dimensions and metrics is often confusing for new users. A dimension is what you want to track (e.g. a page, new users, etc) and a metric is the measurement associated with what you want to track (e.g. the number of pageviews, the number of sessions, etc). This can be a bit confusing at first but it becomes self-evident with practice.

Once you have chosen the dimensions and metrics, you have the option to add a filter. For instance, you could filter on a specific medium such as organic, so only sessions with a medium of organic will appear in your custom report.

Finally you choose which view(s) to associate the custom report with.

Custom reports are a bit tricky so you always have to be sure you understand what you’re asking Google Analytics to do. For instance, if you have a dimension of page and a metric of users, the total number of users reported by the custom report will be correct. But if you add up the number of users associated with each page it will be significantly higher than your total number of users. This is because a user can visit more than one page. What Google Analytics is reporting is correct, but it’s easy to fall afoul of it if you don’t understand the output.

Conclusion

Over the last two posts I’ve looked at how the data set is determined in Google Analytics and reviewed some of the more useful ways the data can be worked with. Understanding when you’re changing what data is being pulled in and when you’re simply working with what’s already available is important as you will be less likely to accidentally damage your data set and you will find it easier to get accurate answers with Google Analytics.

Google Analytics: Determining the data set

In Google Analytics you make choices that change what data gets passed into your reports. Understanding where and how those choices get made is important because they have a profound effect upon the accuracy of your reports.

In this post, I’ll focus on changes that determine the data set that gets passed into Google Analytics’ reports. In the next post I’ll take a look at how you can work with the data in the reports.

Background

graphical representation of Google Analytics account structure

In the Google Analytics hierarchy, you can alter the data set at the view level and by how the code is implemented.

Google Analytics follows a hierarchy of accounts, properties, views and reports. The account is the top-most level of organization.

Each account contains one or more properties. A property is associated with a unique tracking number. Within a property there are one or more views.

In the admin area you can change what data gets passed into the reports. For instance, at the view level you can add filters and set up goals and funnels. At the property level, you can set custom dimensions, which also require a code change.

Within the reports there are various ways to change how the data is reported that don’t alter the data itself. This includes segments, report filters and custom reports.

The data set is determined by how the code is implemented and by changes made at the view level. At the report level, you can manipulate how the data is displayed but you can’t change the underlying data set.

It is important to understand how changes at different points in the hierarchy impact the data because they have a profound effect upon the accuracy of your reports.

Determining Data

Tracking Code

Google Analytics assigns a unique code to each property. That code goes on the pages you wish to track if you are adding it directly to the site or you can add it using Google Tag Manager. Learn more about how to set up the tracking code.

Usually you will want to put the code on every page of your website. If you miss out pages then Google Analytics will not be able to track those pages. This sounds like an inconvenience but it can be fairly disastrous for your data.

For instance, when your visitors move from a tracked page to a non-tracked page it looks like they’ve left the site. If they then move back to a tracked page, they will appear as a new visitor. This will impact a range of metrics including the number of sessions, average time on site and bounce rate.

In the vast majority of cases, you’ll want to put your code on every page your visitors can access. If you don’t put it on every page, carefully consider how it will impact your data and how you can mitigate the results.

Filters

Within each property you can set up multiple views, each with different filters.

The best practice is to have one view which has no filters. This is because filters permanently alter your data. If you have a question that the filtered data can’t answer or there is an error in the filters, then you’ll need to go back to the view which has no filters.

I also recommend having at least one view for testing filters. This is to ensure that a new filter doesn’t accidentally destroy your data as the data is not recoverable. By running the new filter on a test view first you can make sure it does what you expect it to do.

Common filters include removing internal IP addresses, passing in sub-domains, or looking at sessions from specific sources.

Goals and funnels

At the view level you also set up goals and funnels.

A goal is used to track when a user completes an action, e.g. tracking when they visit a page or trigger a specified event. When setting up the goal you will also have the option of adding a funnel. A funnels tracks user behavior through a specific set of steps that lead to a goal.

A very common use case for funnels and goals is to track user behavior through a purchase flow where the last page of the purchase flow is the goal. The intent is to find out where users are dropping off during the purchase flow.

The goal and funnel information can be seen in the Google Analytics report associated with that view. Goals and funnels are not destructive. If you set up a goal or a funnel incorrectly, it won’t damage your underlying data but it may pass unusable data into your report.

eCommerce conversions

To enable eCommerce conversion tracking on your site you can use Google Tag Manager or add code to your conversion page, e.g. the last page of the purchase flow.

When conversion tracking is implemented correctly, Google Analytics will pass purchase information into your report. eCommerce tracking is extremely useful for tying site behavior to purchase information.

As with goals, if the eCommerce tracking is set up incorrectly, it won’t damage the rest of your data but it may pass in bad information.

Conclusion

The data that gets passed into your reports is determined at the view level and by how your code is implemented. If a mistake is made at this level you can’t recover the data.

In this post I focused on some of the most common ways to alter your data set. There are others, though, that I will explore in more detail in later posts.

In the next post, I will look at some of the ways you can work with data at the report level.

Update: Read the related post Google Analytics: Working with the data set.